
Autonomous environmental intelligence for mining operations
See every haul road risk before it becomes downtime, exposure or cost.
DustScout turns your fleet into a continuous sensing network — on-truck instruments, AI-driven analytics and control-room dashboards giving mines a live understanding of dust, corrugation, gradient and surface risk across every site, truck, session and trip. Dust monitoring is where the platform starts — not where it ends.
Since 2016, engineered for mining operations worldwide that take ESG, safety and fleet health seriously.
Why DustScout
One sensor kit, one platform, a complete picture of your haul roads.
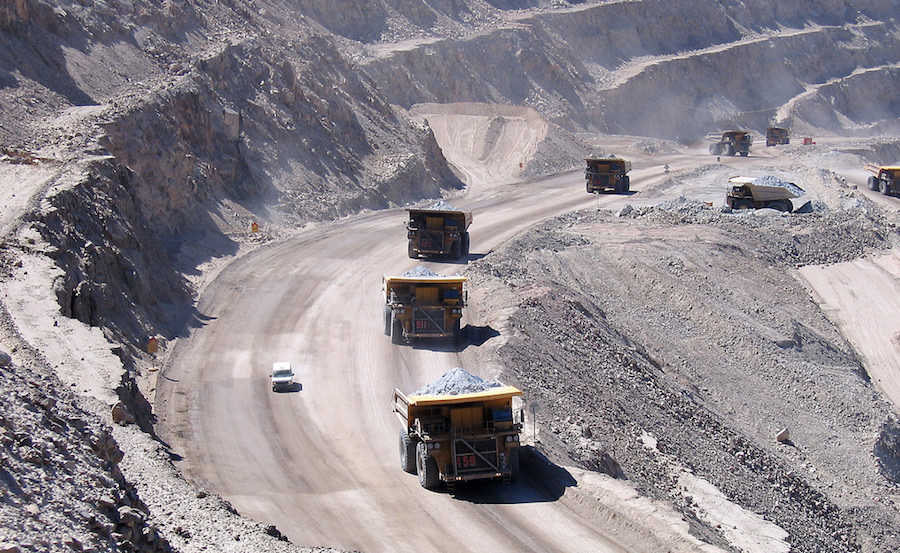
DustScout sits on the truck, listens to the road and streams intelligence into a central control panel. Not just dust readings, but an operational narrative for every trip: where dust spikes, where corrugation emerges, where gradients bite and where road temperature silently increases risk.
SEC. 01 / SYSTEM VALUE
Truck-mounted sensing
A compact DustScout unit sits on the truck and captures dust, vibration, speed and road temperature in real time, mapped precisely to the road — built for harsh environments and intermittent coverage.
AI-driven analytics
Data streams into Sentinel's cloud and is converted into interpretable scores, segments and recommendations operations can use immediately — corrugation patterns, gradient issues and risk trends detected automatically.
Actionable playbooks
DustScout suggests watering, grading and road interventions where they will have the highest impact, backed by a transparent data trail traceable to specific road segments and conditions.
The Dust Fingerprint
Every road segment has a signature. DustScout reads it.
Ten channels — PM₁ to PM₁₀, moisture, road temperature, corrugation, speed, wind and position — compressed into one radial signature per segment. Operators learn to read fingerprints the way meteorologists read weather radar: a glance tells you whether Ramp B is drying out, whether the crusher approach is corrugating, whether the night shift left the loop better or worse than it found it.
SEC. 02 / SIGNATURE
Meet SilicaSense™
The next generation of silica risk awareness — without the lab.
SilicaSense™ analyses real-time particulate behaviour, concentration patterns and environmental conditions to identify the signature of conditions where respirable crystalline silica is most likely present — transforming existing dust data into actionable silica risk insight, long before hazardous exposure occurs.
SEC. 03 / FLAGSHIP CAPABILITY
Real-time risk inference
Identifies dust conditions linked to high silica likelihood using advanced particulate modelling. Works with existing DustScout hardware — no new sensor required.
Self-calibrating site model
Learns your material behaviour over time and generates a clear Silica Risk Index for every zone and route, updated continuously.
Targeted suppression
Water only where risk is rising — reducing water usage by up to 90% — with early-warning alerts via dashboard, SMS or API.
How you navigate DustScout
Site, truck, session, trip. One coherent model of your haul operations.
The platform is built around the same objects your operations team lives in. Every view, every alert and every report flows from these four lenses.
SEC. 04 / OPERATING MODEL
Sites & haul circuits
Register each mine site, define haul roads and dump pockets, configure compliance thresholds and alert rules that match local regulations and ESG commitments.
Trucks & fleet registry
Onboard trucks with serial, fleet number and OEM details, link DustScout units and see which trucks are generating coverage and which need attention.
Sessions & shifts
Group trips into operator sessions and shifts for clean reporting. Ask simple questions like how dust evolved during the last night shift on A12.
Trips & replay
Reconstruct a single loaded or empty trip as a playable track with dust zones, gradient markers and event flags that tell the story of the road.
Platform
Edge to cloud to control room, with a ledger of every event.
DustScout is built as an opinionated pipeline — from sensor hardware in harsh conditions to clean APIs for reporting and ESG disclosures. Every reading flows through a structured, auditable path.
SEC. 05 / ARCHITECTURE
DustScout sensor kit
- —On-truck sensing for dust, vibration, temperature and speed
- —Local processing for noisy environments and intermittent connectivity
- —Buffering and retry logic so trips are never lost when coverage drops
Streaming & AI interpretation
- —Ingestion via secure IoT and API pipelines
- —Segmentation into road segments with dust and condition scores
- —ML models detecting corrugation patterns and risk trends
DustScout control room
- —Map and timeline views for sites, trucks, sessions and trips
- —Notification centre for corrugation, gradient and pothole events
- —Exports for reporting, ESG documentation and regulators
Screens
Built for control rooms, supervisors and ESG teams that need clarity at a glance.
High information density, clear status colours and layouts tuned for daily use — on a control-room wall at 03:00 or a laptop in a planning meeting.
SEC. 06 / CONTROL ROOM
Haul road live view
Real-time dust levels along the haul route with waypoint markers and automated watering suggestions.
Run summary & ESG reporting
Summaries you can paste straight into ESG packs, incident reviews and contractor discussions.
Every view in DustScout is built for daily operational use. The same data that powers control-room dashboards flows seamlessly into compliance documentation and operational planning — one coherent narrative of your haul roads that operations can use immediately and ESG teams can trust.
Beyond dust
A digital understanding of the haul road.
Dust is where DustScout starts. The same fleet-mounted sensing network and AI pipeline delivers a complete environmental and road-condition intelligence layer — all of it running on the platform today, from the same data.
SEC. 07 / FULL PLATFORM
Road-condition intelligence
Corrugation, gradient and pothole detection from on-truck vibration — flagging events on every instrumented trip.
Predictive deterioration
Segment-level forecasting of where the road will fail next, so grading and watering move from reactive to scheduled.
Tyre wear & exposure analytics
Road temperature, surface events and speed correlated into tyre-stress insight — and operator exposure analytics built on SilicaSense™.
Autonomous maintenance recommendations
The platform closes the loop: prioritised watering, grading and intervention plans generated from live road state, ready for dispatch.
Every trip driven deepens the picture — a growing digital record of how your haul roads behave, degrade and respond to intervention.
Ready to see your haul roads with DustScout clarity?
Request a live walkthrough with real telemetry, or talk to us about a pilot on your site.